
Call walls, put walls and the gamma flip
The three levels on every SteadyTrader chart — what builds them, and what they are not.
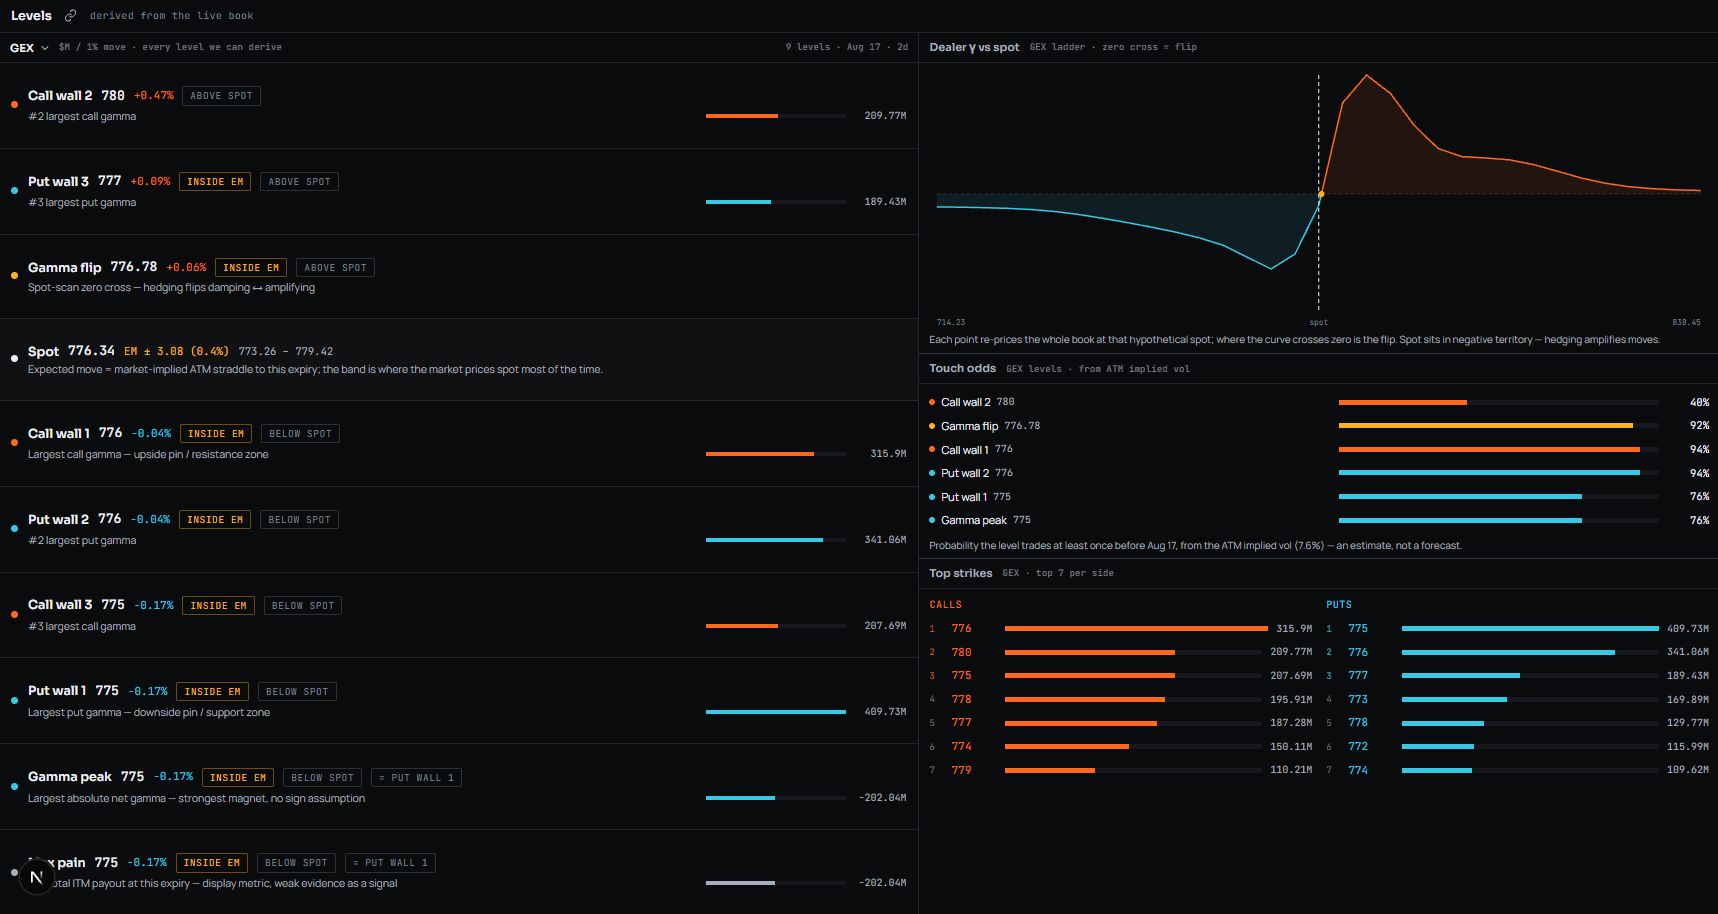
Open any symbol in the terminal and three levels are drawn before anything else: the call wall, the put wall, and the gamma flip. They are the compressed version of the whole exposure profile — the places where dealer hedging is most concentrated, and the price where its character changes.
The call wall
The call wall is the strike carrying the largest call gamma. Below it, dealers who are long those calls sell stock as price rises toward the strike — their delta is growing and they trim against it. That steady supply is why strong rallies so often stall at the same round strike everyone is watching — the clustering of prices at heavy strikes into expiration is one of the better-documented regularities in the literature (Ni, Pearson and Poteshman, 2005; Avellaneda and Lipkin, 2003).
A wall is not a ceiling. It is a price where rallies meet mechanical selling, which slows them. When price closes through a big call wall and holds, the wall above it becomes the next point of interest — and the hedging that resisted the move often flips to chasing it.
The put wall
The mirror image: the strike with the largest put gamma, usually below spot. Dealers short those puts buy stock as price falls toward the strike, which is why hard selloffs frequently pause at a heavy put strike even when the news has not improved.
The put wall is often the more emotional level, because it gets tested on red days. The mechanics do not care — supply and demand from hedging works the same in both directions.
The gamma flip
Somewhere between the walls, net dealer gamma crosses zero. Above the flip the regime is dampened; below it, amplified. The flip is found by scanning the whole profile across spot prices rather than reading a single strike, because exposure at every strike changes as spot moves.
Crossing the flip is the moment the market’s suspension changes — the same tape that faded every move all morning starts extending them. Traders who do not track the flip experience this as the market “changing character for no reason.”
Sources and further reading
The research this guide leans on. Citations rather than links, so they stay verifiable after journal URLs move.
- Ni, S.X., Pearson, N.D. and Poteshman, A.M. (2005). Stock price clustering on option expiration dates. Journal of Financial Economics 78(1).
- Avellaneda, M. and Lipkin, M.D. (2003). A market-induced mechanism for stock pinning. Quantitative Finance 3(6).
- Ni, S.X., Pearson, N.D., Poteshman, A.M. and White, J. (2021). Does Option Trading Have a Pervasive Impact on Underlying Stock Prices? Review of Financial Studies 34(4).