
Reading volume footprints
Bid-ask volume inside every bar: delta, imbalances, and unfinished auctions.
A candle tells you where price went. A footprint tells you who paid to move it. Each bar is split by price, and each price shows two numbers: contracts sold into the bid, and contracts bought at the ask. Everything footprint traders talk about — delta, imbalance, absorption — is arithmetic on those two columns.
Delta: who was more aggressive
Delta is ask volume minus bid volume — buys lifting the offer against sells hitting the bid. Positive delta means buyers crossed the spread more; negative means sellers did. It measures aggression, not correctness: heavy buying into a wall of resting sell orders produces big positive delta and no progress, which is itself the message. Under the hood every print is classified buyer- or seller-initiated with the Lee and Ready (1991) rule — the same convention most academic microstructure work uses.
Imbalances: one side folding
Compare diagonally — buys at one price against sells one tick below, because that is how aggression actually consumes the book. A stacked run of, say, three-to-one imbalances on consecutive prices marks a small capitulation: one side stopped defending. Clusters of stacked imbalances are where footprint traders start caring, single ones are noise.
Unfinished business
An auction that ends with heavy trading at the extreme — no taper, no zero-print at the high or low — left business unfinished. Price tends to revisit those extremes, not because of magic but because an auction that never found the last seller has not established the edge of value. Mark them; they make honest targets.
Where GEX fits
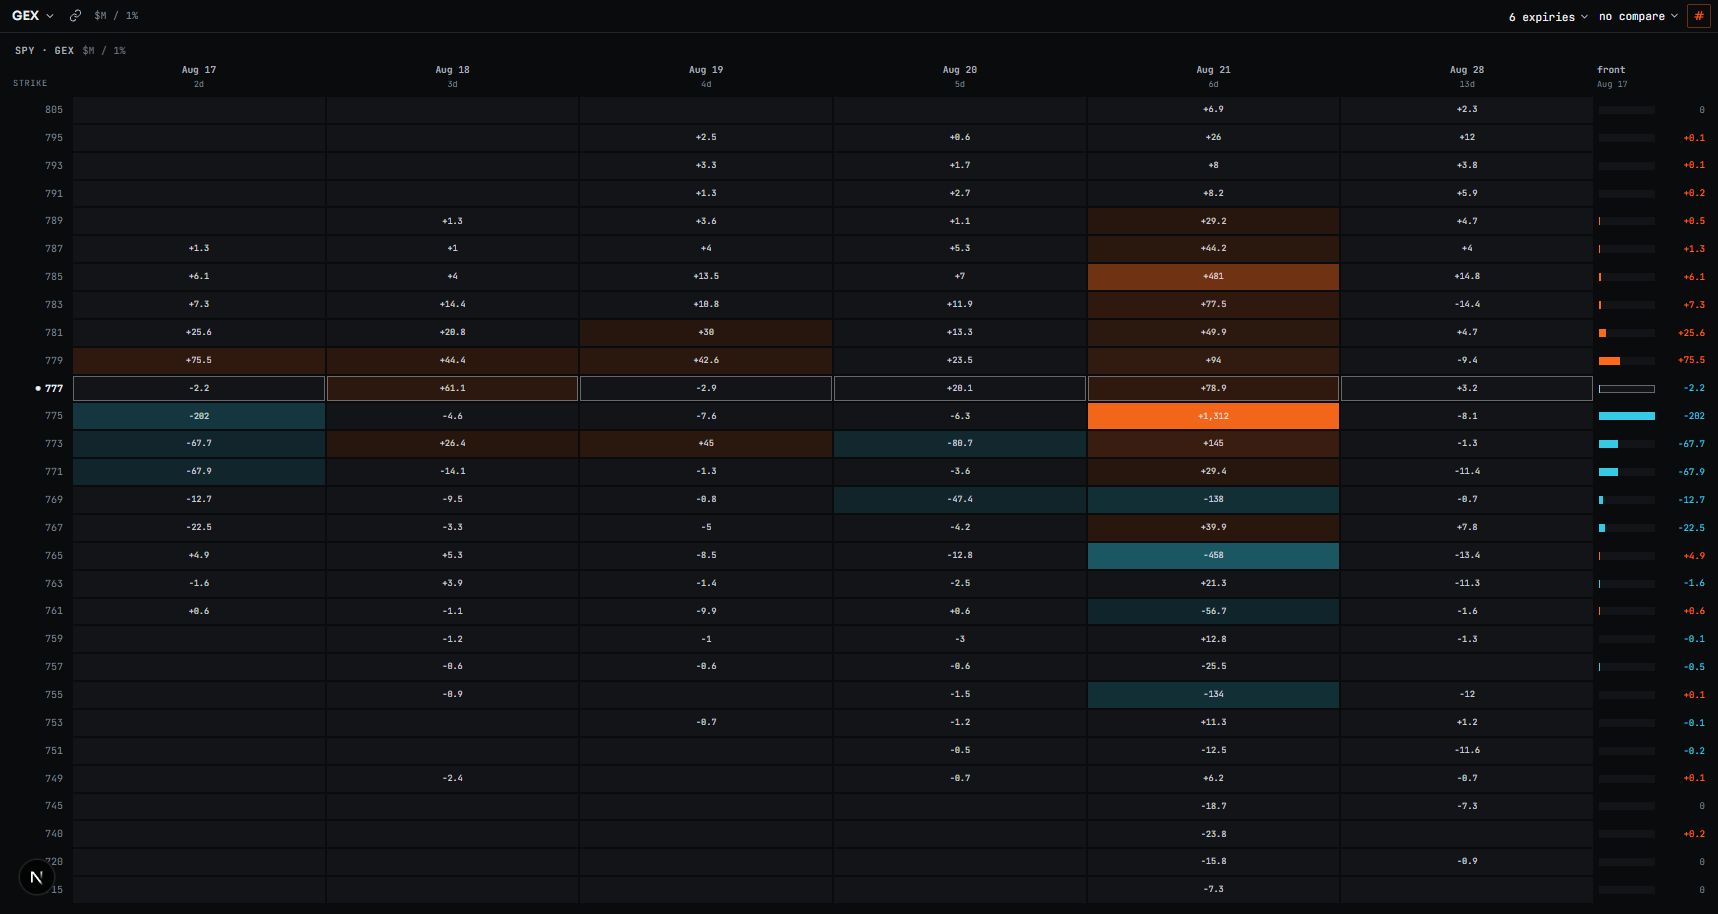
Footprints answer a different question than positioning: not “where will hedging lean” but “who is winning right now.” The combination is the edge — a put wall is interesting, a put wall where sell imbalances dry up and delta turns is actionable. Use the map to choose where to look, and the footprint to decide when.
Sources and further reading
The research this guide leans on. Citations rather than links, so they stay verifiable after journal URLs move.
- Lee, C.M.C. and Ready, M.J. (1991). Inferring Trade Direction from Intraday Data. Journal of Finance 46(2).
- Cont, R., Kukanov, A. and Stoikov, S. (2014). The Price Impact of Order Book Events. Journal of Financial Econometrics 12(1).
- Harris, L. (2003). Trading and Exchanges: Market Microstructure for Practitioners. Oxford University Press.